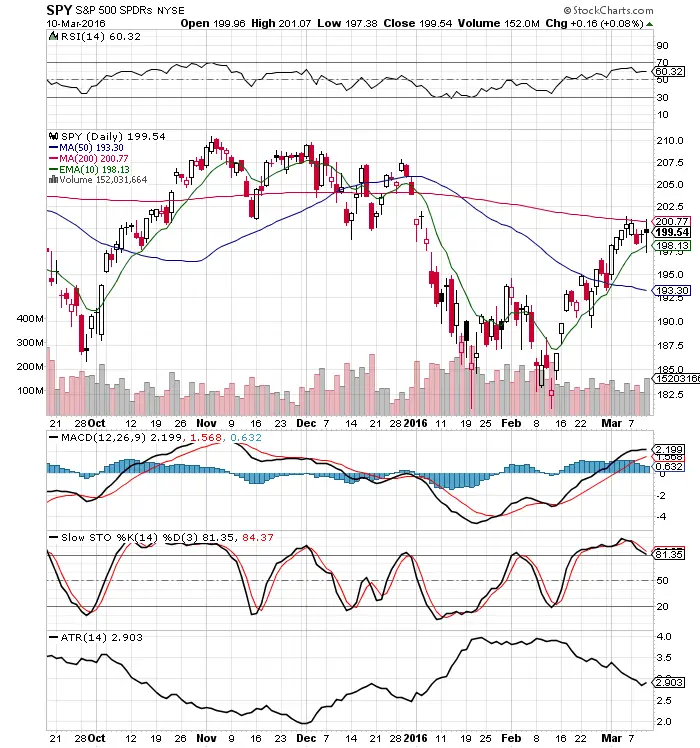
Here are 5 basic technical indicators to get you started in trading price action instead of anyone’s opinions or predictions.
- Moving averages tell you the trend in your time frame based on what side price is on in relation to the moving average, price above the moving average can be bullish while prices below it can be bearish: the 200 day identifies the long term trend, the 50 day is midterm, and the 10 day is the short term trend. Ascending and descending moving averages also can help identify the trend in prices. Prices tend to return to short term moving averages like the 10 day EMA every few days. When price is very extended above the 10 day EMA by multiple ATRs it is usually due to a reversion to the mean in the majority of cases.
- The Average True Range (ATR) helps understand the trend in your stock’s price volatility. It also helps you position size appropriately based on the risk of potential of current price movement.
- Slow Stochastics crossovers can help you swing trade in markets. It follows the speed and the momentum of price. As a rule, the momentum changes direction before price. Bullish crossovers and bearish crossovers can help identify the timing for getting long or to sell short at short term turning points in price action.
- The MACD helps a trader identify trend and momentum. It is one of the most simple and effective momentum indicators available. The MACD offers the best of both worlds: trend following and momentum. Traders can look for signal line crossovers for entries based on momentum for longer term trends.
- The Relative Strength Index (RSI) is a technical momentum indicator that compares the magnitude of recent gains to recent losses in an attempt to determine when a market may be overbought or oversold. Overbought readings are when RSI is near 70 and oversold conditions are considered when RSI approaches 30. This indicator works best with slower markets like stock market indexes, sector ETFs, and big cap stocks.