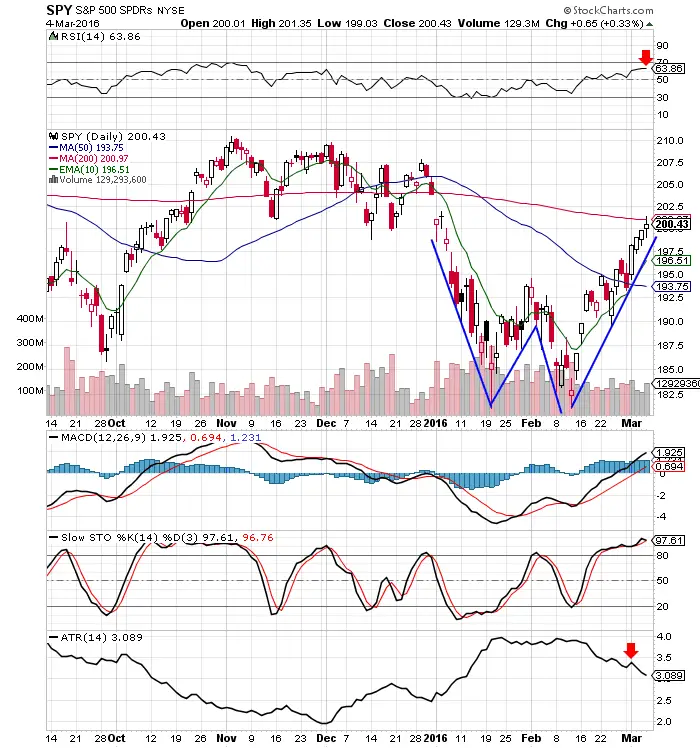
- Bulls had control last week driving stocks higher day after day with little intra-day weakness.
- The bullish double bottom played out as the rally took the $SPY back to the 200 day SMA.
- The 200 day SMA is the current resistance level. A close over the 200 day will finally put the bulls in control and cause trend followers and momentum traders to start trading the long side again.
- The MACD and Slow Stochastics are both still bullish here.
- The ATR is in a downtrend as volatility decreases.
- With RSI at $63.86 the risk/reward ratio has finally turned against the bulls. The odds here favor a pullback or that a trading range develops before more upside.
- $SPY finds itself having gone too far too fast and is now extended two ATRs from the 10 day EMA. The odds favor a pullback to the 10 day EMA at some point next week. The 10 day EMA may be higher when it pulls back.
- The up days last week finally have volume higher than the down days. This is a great start.
- The 200 day SMA battle continues next week. We may finally see a break and trend one way or another after the 200 day being traded around for the past year. Bullish above and bearish below the 200 day is the best policy long term for trend traders.
- Reality check: $SPY is still negative in 2016 and trading at the same price it did in November 2014. Stocks as an asset class continue to be traded not accumulated. $SPY needs to get back over the 200 day and then reach all time highs to make this market truly bullish again. We are currently in a swing traders market and range bound.
Full Disclosure: I am currently short via $TZA.