- Stocks as an asset class are under distribution worldwide in 2016.
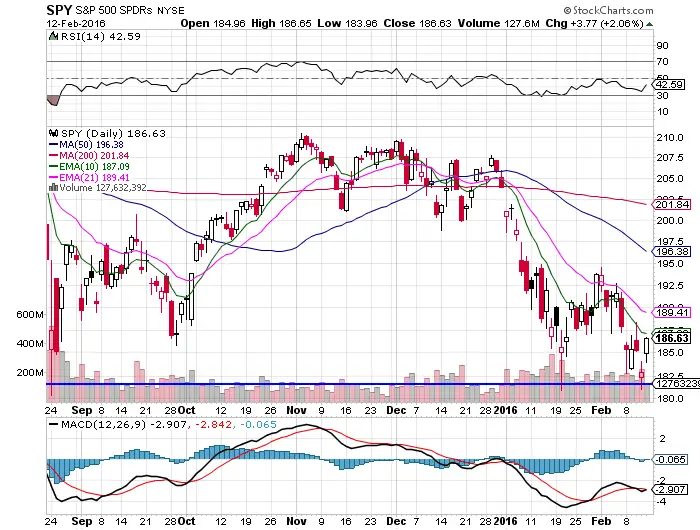
- $SPY is in an intermediate downtrend under its 200-day SMA.
- The MACD is still in a bearish crossover.
- $SPY has closed under the 10-day EMA 24 out of 29 trading days in 2016.
- The 10-day EMA has been resistance this year.
- The 21-day EMA is the secondary resistance.
- The $SPY volume on Friday was the second lowest volume day of the year, which is not a good validation of the up day.
- RSI at 42.59 continues to show a lack of momentum.
- For the bulls to show they are back in control, $SPY has to close over the 10-day EMA and the 21-day as the first bullish momentum signal. Until then, the bears can continue to take the market lower after each rally.
- $SPY had its biggest drop in the first 28 trading days-ever.
S&P 500 down 10.5% in the first 28 trading days of 2016. The worst start to a year in market history. $SPX pic.twitter.com/qkt6lYOZbO
— Charlie Bilello, CMT (@MktOutperform) February 11, 2016