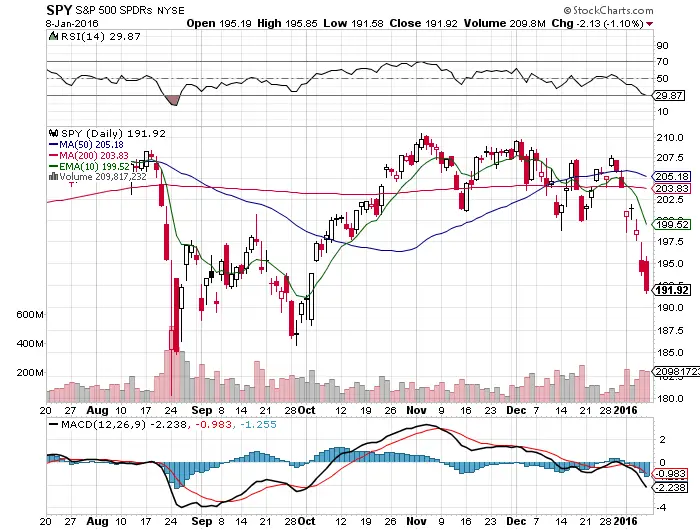
- Last week, the market shifted from range bound to a short term downtrend as it broke through the October gap up in price.
- We have shifted to a market environment where selling the rallies short is being rewarded with profits, and buying dips and price weakness is being punished with losses.
- $SPY is trading under the 200 day SMA in a short term downtrend.
- The MACD still has a bearish crossover.
- The RSI closing below 29.87 shows the danger of more downside because the 30 RSI didn’t hold as end of day support.
- Price is far extended from the 10 day EMA, setting up the potential for a snapback rally next week.
- A sell-off on the payrolls Friday after the rally showed price weakness.
- One potential reversal signal in $SPY would be price closing over the previous day’s high of day.
- The $185 price level is a strong near term support and buy the dip zone.
- The after holiday trading week with higher volume has shown distribution in the equities market.
It is time to trade smaller, shorten time frames, buy only the most extreme dips, and short the strongest rallies. There is a good chance we see both a short term capitulation plunge next week, and a big gap up day to press shorts.