Skip to content

Bullish Facts about the $FB Chart
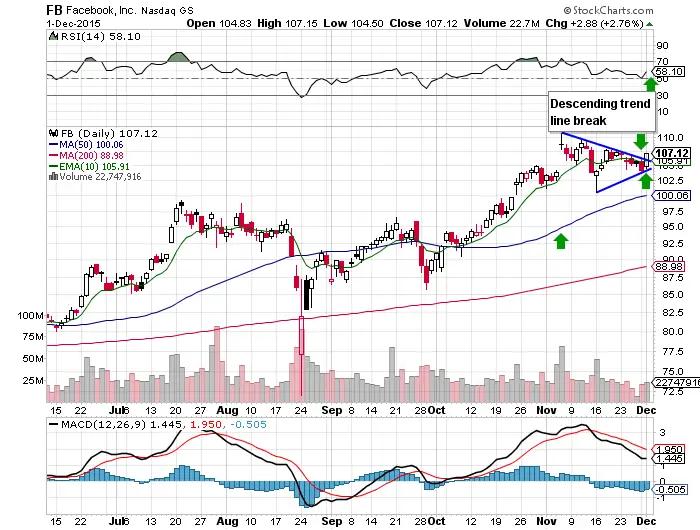
- All short term moving averages are over long term moving averages: 10 day over the 20 day and 50 day over the 200 day.
- Price broke above the 10 day EMA after being below it for four days.
- Price broke back above the 17 day descending trend line.
- The RSI is bullish at 58 with room to run higher.
- The 50 day SMA is ascending upwards.
- $FB is within $3.50 of all time highs leaving the majority of shareholders with little pressure to sell.
- $FB broke out to the upside of the asymmetrical triangle which is usually a continuation pattern of the previous trend.
