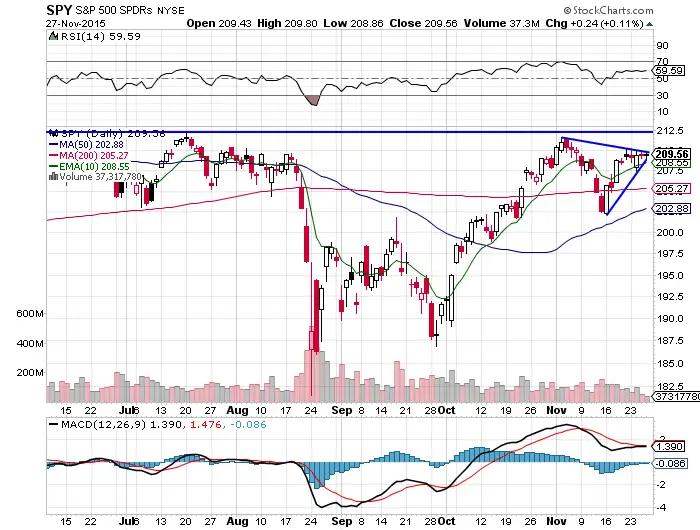
- Last week the stock market did an amazing job recovering from bad news, terrorist threats, and the Russian/Turkey pilot incident. Rallying on bad news is bullish.
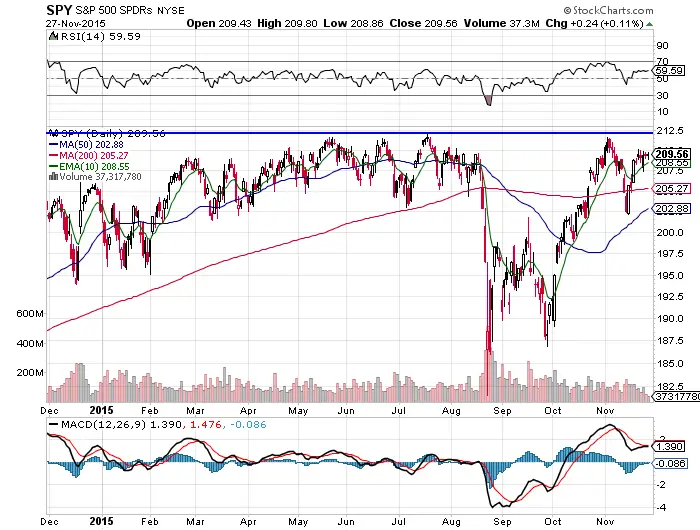
- Being within striking distance of all time high prices is bullish for $SPY.
- For the past seven trading days the 10 day EMA has acted as end of day support.
- For the past 10 days $SPY has maintained a lower trend line that is ascending with higher lows which is bullish.
- The current triangle chart pattern has a high probability of being bullish or a continuation pattern due to it’s structure.
- The MACD had a bullish crossover Friday.
- The RSI is bullish at 59.59 showing momentum in price.
- Overhead resistance stands at $212.08 adjusted for dividends and $213.78 unadjusted as the all time high in $SPY. This is a highly probable target before year end.
- If $SPY challenges all time highs for a 5th time this year the odds are that it breaks out. The more that a level is tested the higher the odds that it does not hold.
- December is seasonally strong for stocks and there is a good chance we see a Santa Rally into the end of the year and a continued up trend.
Full disclosure: I am long $SPY $BABA and $TSLA.

