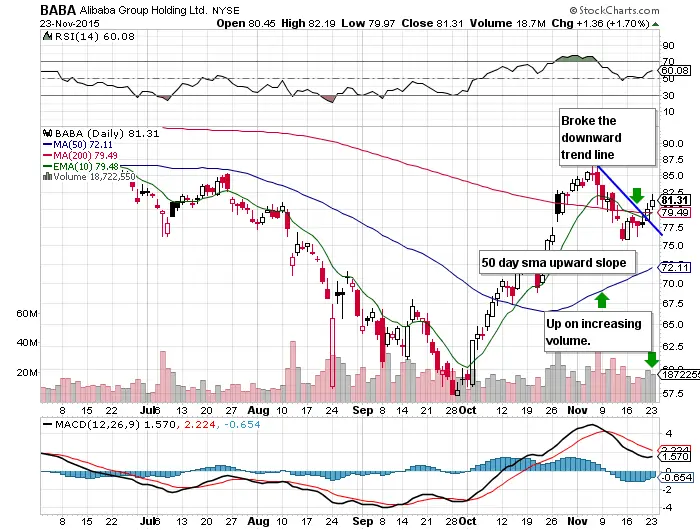
- $BABA broke the downward trend line.
- It broke over the 10-day EMA.
- It broke over the 200-day SMA.
- The 50-day SMA has begun to slope upwards.
- The 60 RSI is bullish and gives it room to climb higher.
- It rallied as the rest of the market was down Monday.
- $BABA continues to go up on increasing volume.
- For three days, $BABA has made higher highs and higher lows.
- $BABA is the $AMZN of China, only much bigger.
- The $BABA chart has the potential to be a big, bullish cup with handle pattern.
(Full disclosure: I am long $BABA from Friday)
