Skip to content

- The chart had a lot of mixed signals last week without many actionable signals.
- The Fed decision to keep rates unchanged was a sell the news event.
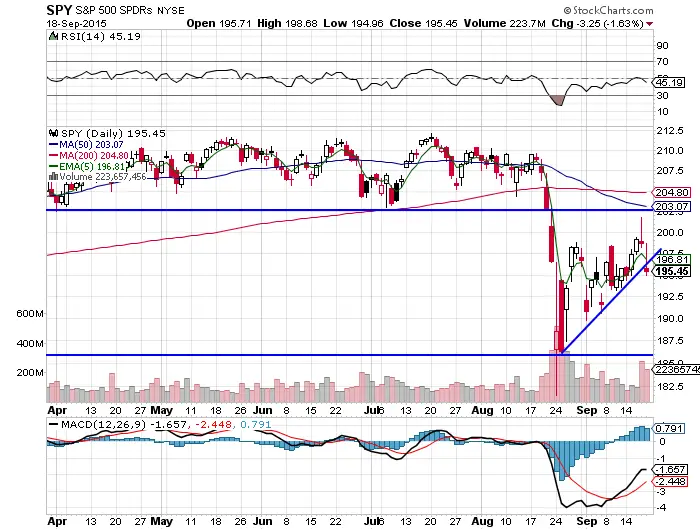
- $SPY has settled back into a trading range after failing to breakout on the Fed decision.
- Two back-to-back shooting star candlesticks show that higher prices were sold into for two days straight.
- Current resistance is $203 and current support is $186.
- The ascending triangle chart pattern was broken Friday to the downside, ending the short term reversal from the recent bottom.
- The MACD is still bullish.
- Thursday and Friday were both down on high volume, which may be a warning for lower lows.
- The RSI is bearish at a 45 reading.
- The short term path of least resistance is down.
