 For the first time in many years buying the dip failed in the stock market. It failed with an enormous plunge in the Dow Jones Industrial Average of over 1,000 points from Monday’s open of 17,472.66 to Friday’s close of 16,459.75. This brings the DJIA into a +10% correction from a 52 week high of 18,351.40 to the Friday close. The speed of the selling of stocks on Thursday and Friday was incredible. No rally went unpunished, as each rally was just an opportunity for more sellers to exit at better prices. The market participants on Thursday and Friday consisted of people that wanted out of stocks at any price, bag holders that didn’t sell, and sellers willing to exit at ridiculously low prices. That type of price has been very rare over the past several years, and reminds me of 2008 trading with plunges that met little if any dip buying. The market changed it’s nature Friday, and the easy money of 2009-2014 are behind us. It’s a brave new world. Markets don’t go straight up to all-time highs after every dip, and you get paid for trading not holding positions.
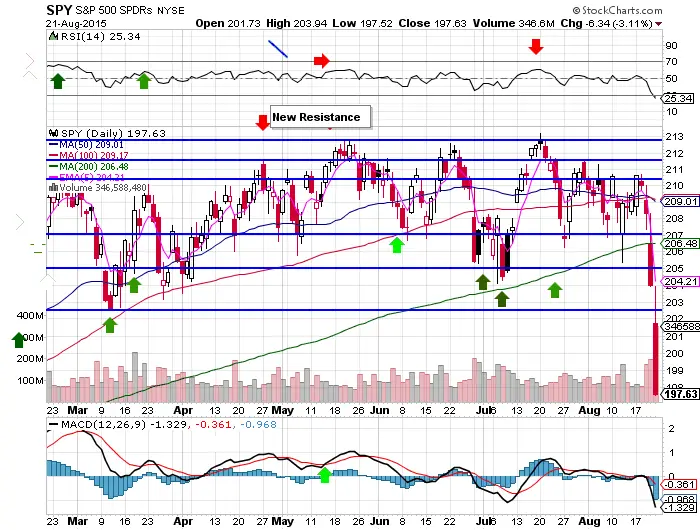
Here are the 10 key facts on the $SPY chart from last week:
- The range was broken and we are now in a downtrend on every time frame. The trend was fast and furious. Trend following systems that use the 200 SMA as their short trigger worked for the first time in years for a nice gain on Friday. The speed of the plunge under the 200 day was much faster with $SPY than the other indexes.
- All major index ETFs are now under the 200 day SMA. The market has shifted from ‘buy the dip’ to ‘sell the rip’. Shorting strength has better odds of success now than buying dips.
- All major support levels were lost last week on $SPY: the 200 day, the 30 RSI, and $202.50. There were not buyers defending these levels like in previous sell-offs. Sellers had to search for bids as the market kept going lower.
- Under the 200 day, the odds favor short plays to go in the direction of least resistance.
- The 30 RSI not being recovered by the end of the day was a rare event, and it serves as a warning that we could see a dangerous plunge in coming weeks like the flash crash of 1987 or 2008. Panic selling has no support and fear creates moves that are hard to believe.
- All the $SPY chart indicators are bearish.
- All the $SPY chart indicators show this market is way oversold, but buyers don’t care yet.
- $VIX at 28 is the highest since October of 2014, which shows we should find a near term place to bounce back. This makes put options expensive, and is an environment that option sellers love to sell premium because it is priced high.
- This is the type of market that will tend to start high and end lower. It will rally, but the rallies will be intra-day and faded.
- How we trade inside of Friday’s price range will be very revealing. Which side of the range breaks will be very telling of the trend. We can expect wide intra-day rallies next week, and strong, low volume rallies that will likely fade.
Be careful out there. Trade small, and honor stops losses.