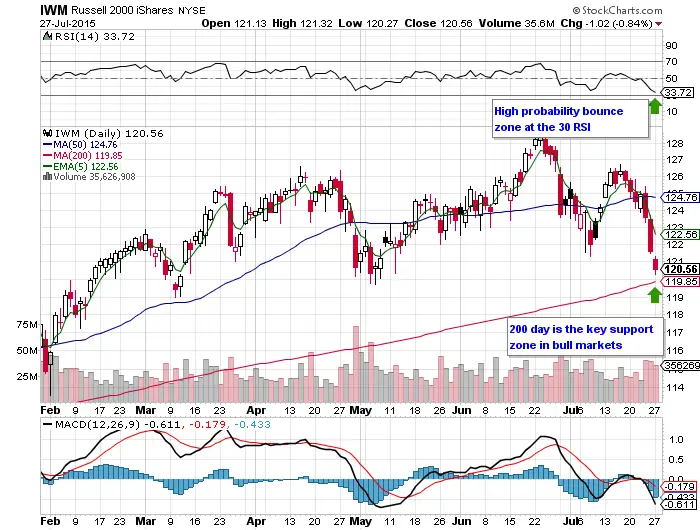
Historically, he 30 RSI oscillator is the key end of day support zone for $IWM. This entry is a standalone high probability long signal, for an initial bounce and potential short term bottom, as a swing trade.
The 200 day simple moving average is the key long term support line in a bull market uptrend, and usually holds the first time price when it is first tested.
$IWM is extended $2 and over 1.6% away from the 5 day EMA. Even in downtrends, price tends to retrace back to the 5 day EMA every day or two.
$IWM has made a lower low, seven straight days. The odds of a bounce increases when equities have this many days of distribution.
Odds of a bounce increases when key support levels converge at one place and price follows. They happen when price enters the zone of the dip buyers. Dip buyers live at the 200 day and 30 RSI, and price is knocking on their door.
