Photo credit: Jeremy Schultz
As a Pro student of New Trader 101, and dedicated weekly participant in the live forums that I host, Fred has picked up some tips and tricks that led him to this (if I do say so myself) great trade.
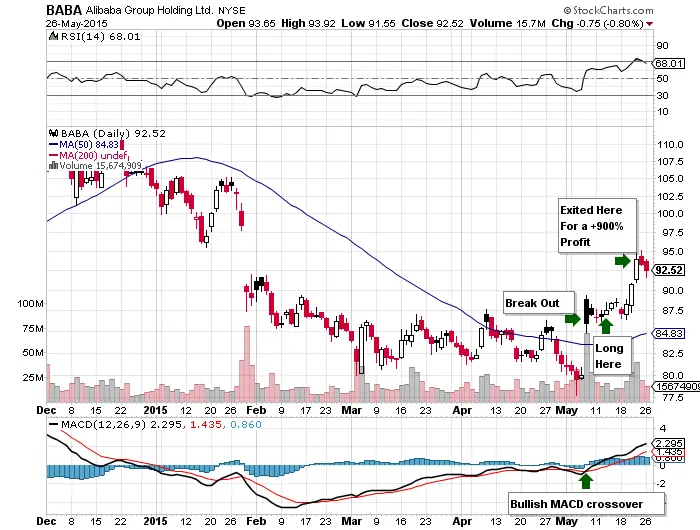
1. On May 7th, $BABA broke out above its 50 day moving average, as well as it’s 5 day exponential moving average, indicating momentum.
2. I noted its low and high of day price of $84.91 and $89.29; neither were broken. I placed it on my watch list, and also noted the RSI, MACD and Stochastics. RSI was in the high 50’s – low 60’s area, so there was still room to run. Stochastics were not overbought, and the MACD had just crossed over.
3. On May 13th, $BABA made its 1st attempt trying to break out of its 3 day consolidation. I went long in the morning with May 22 weekly $92 strike call options. I figured if it broke out, $BABA should move at least 5-7%. My position was sized at .70% of my total trading capital. My stop loss was 100% loss. Due to the nature and volatility of options, I sized my position based on worse case scenario. If the trade did not materialize, only .70% of my capital was at risk.
4. Over the next 2 days, $BABA did not break out, but it did continue to post higher lows.
5. On May 18th, negative news came out regarding $BABA. This caused the stock to gap down, but since I use the end of day price as my stop, I wasn’t stopped out as the price recovered by end of day and maintained its 5 day ema. To me, this was a bullish signal as the price gapped down but maintained support. Since I had been watching the stock since its IPO, I knew this was not $BABA’s typical price action.
6. On May 21st, $BABA finally did its gap and go, climbing as high as $94.77. When the momentum is there you need to take your gains, so I sold my options when they were up 900-950%.
