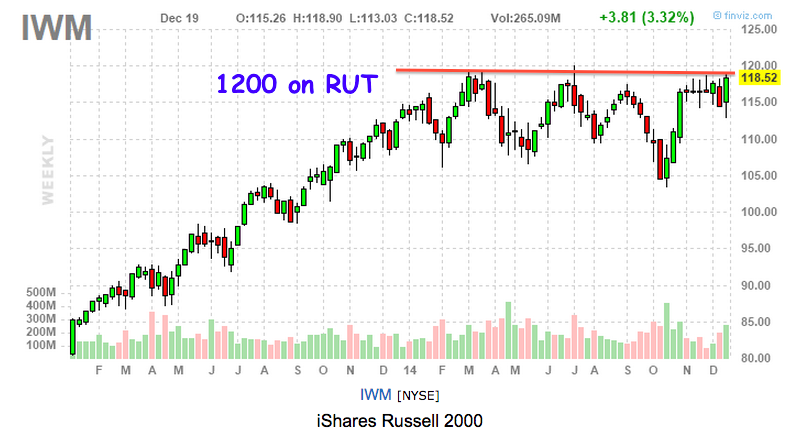
$IWM is breaking out of a year long price base. Are you ready? This is why I am bullish on breakouts:
I will be watching the $118.50 level in $IWM next week that coincides with the 1200 level in the Russell 2000 index. A stronger break and close above this level could result in the old resistance becoming the new support, and a breakout then uptrend running until the end of the year. $IWM on the daily has the RSI at 59, which gives it plenty of room to break and run. I will be a buyer with a 2nd close above the $118.50 and my stop will be a close below that old resistance level.
Tell me what you think. Tweet me @sjosephburns