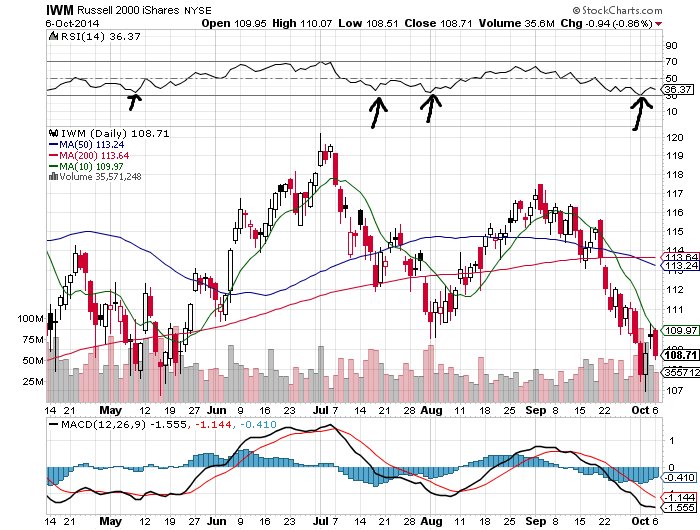
In the past year the 30 RSI indicator has been the bounce zone for the Russell 2000. Even when this level is lost it has been recovered by the end of the day in the majority of incidences. This is the bounce zone from a technical standpoint. This also still correlates with recent low prices on the chart if we get back there. I will be entering a long equity trade using $TNA near the $IWM 30 RSI with the stop loss at an end of day close below the 28 RSI on the daily chart. I will stop out the same day it is going to close below that level at the end of the day. My profit taking target #1 will be the 10 day sma if it get there and the 50 RSI is my #2 target if the first target is over taken strongly. Great risk reward here and I will position size accordingly.
Where I Will Be Buying the $IWM Dip
