Skip to content

-
The long term stock market up trend is still firmly in place.
-
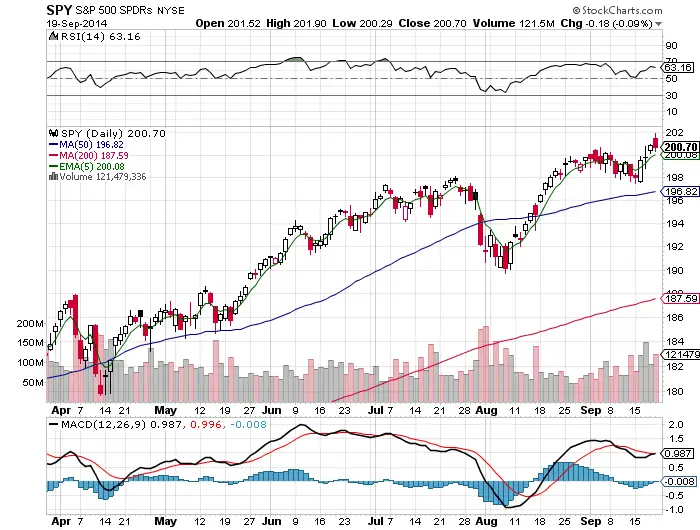
All time highs still being within striking distance is still a bullish sign.
-
Quadruple witching caused much of the volatility Friday as traders settled contracts across markets.
-
The 5 day ema being broken above and held is a bullish sign that could be a sign of even higher prices ahead.
-
A close below the 5 day ema would be the first sign of losing momentum.
-
The best odds for success and profitability in this market environment is still in buying price dips.
-
The RSI at 63 gives more room for upside to the 70 RSI resistance level.
-
Near term support levels in this market are a high probability at the 50 RSI and the 50 day sma.
-
Being a bear in this market environment has been expensive. The market is simply being bought quickly at every opportunity.
-
I am still long $SPY with a full position size going into Monday. My stop is a close below the 5 day ema.
