-
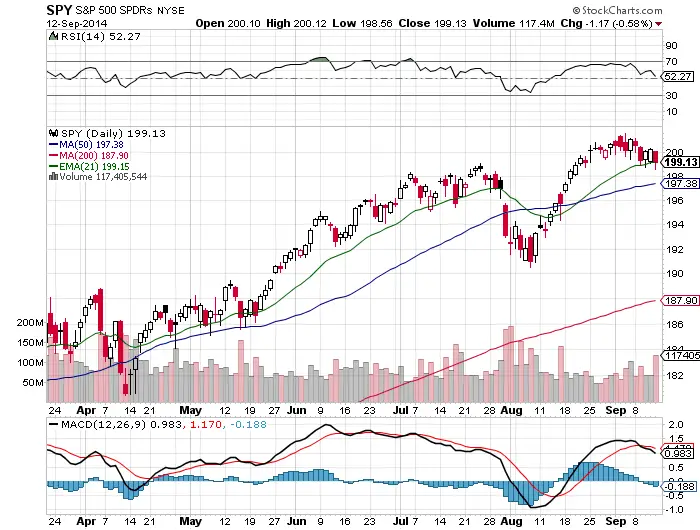
The last four trading days has been in a $200.55 resistance and $198.56 support range hardly a down trend of bearish.
-
The long term up trend is still intact and price is still within striking distance of all time highs.
-
The 21 day ema has acted as end of day support since that line was broken above 22 trading days ago.
-
Price is still over the 50 RSI which is bullish. From the end of April through the end of July the 50 RSI acted as end of day support.
-
Since August 20th $198 has held as support intra-day. Since August 21st $199 has held as end of day support.
-
The 50 day sma is the next line of support and if we go their is a very high probability bounce zone. The buy the dip crowd is likely lined up there.
-
The 21 day ema and 50 day sma are both still up sloping trend lines.
-
I am still long this market using $SPY and $TNA with tight end of day stops. A close below the 21 day ema is my $SPY stop and a close below the $IWM 50 day sma is my $TNA stop. I have on my full position size here.
-
Naturally uncomfortable trades are usually the best trades, because you are positioning yourself ahead of the crowd not behind it. The bearishness I hear all around me on social media makes me glad becasue that means that most went home flat Friday or they are already out. So the odds are in favor of them having to get back in next week. We’ll see.
-
The market is right at the crossroads. For the short term uptrend to stay intact the key support convergences of $199, the 50 RSI, and they 21 day ema need to hold up or at least recover by the end of the day if lost or we will have a sign of some trouble in the short term time frame.
