-
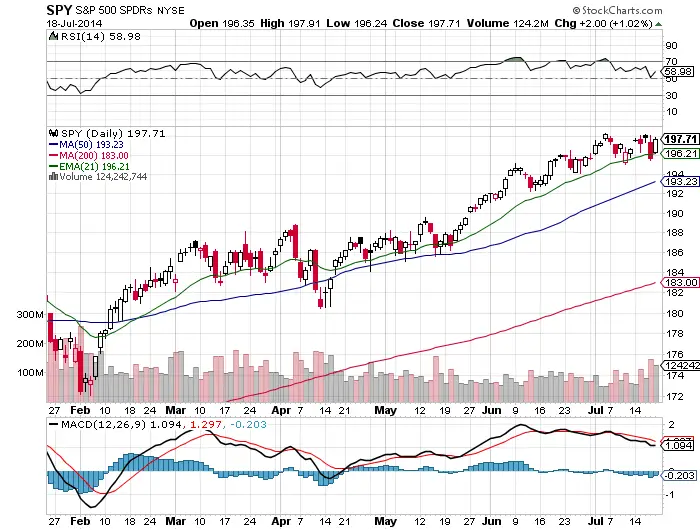
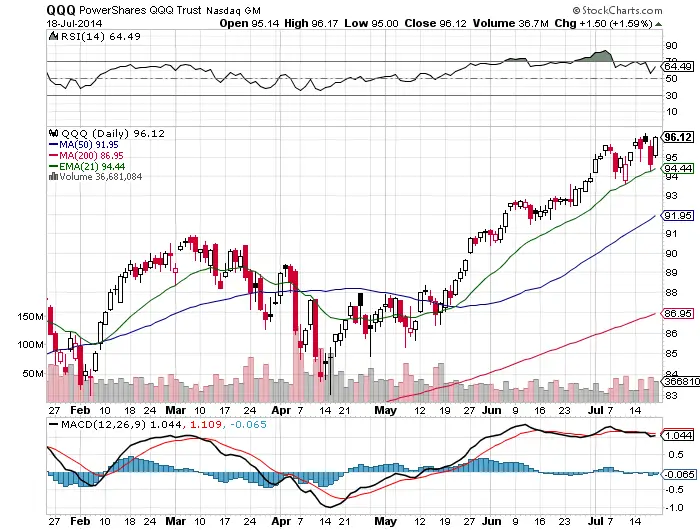
The long term uptrend in the stock market is still in place.
-
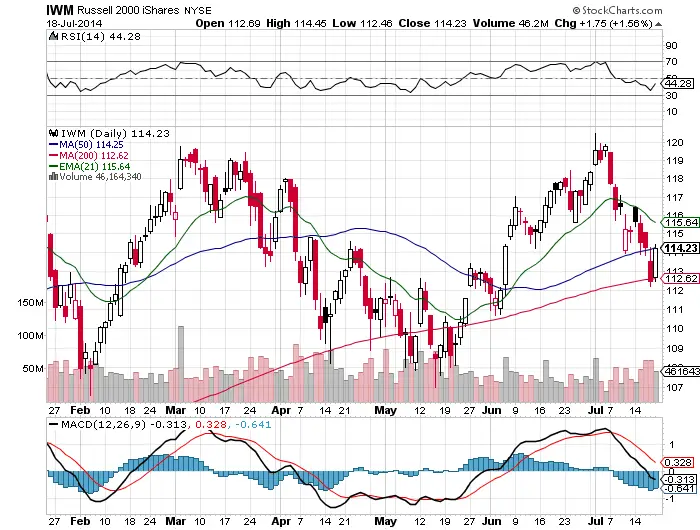
This is not the stright up parabolic move of 2013 where the 5 day ema and 10 day sma worked as a trend filter. This year indexes are trading in a wider range with the 21 day ema and 50 day sma are the key lines to watch for pull backs and swing long entries.
-
This is a fast market and requires buying dips fast, there are no follow through days either way, quick retracements then bounce backs are fast. Rarely are we even down two days in a row.
-
Short side traders have been getting hurt when they short into weakness right before a snap back or try to short strength and the market goes yet higher. Swing trades from the long side have the best odds for success.
-
$QQQ is the strongest index and $IWM is the weakest.
-
$IWM has met resistance at both the 21 day ema and the 50 day sma last week.
-
Buying $IWM at the 30 RSI would be a very high probability long if we get there.
-
Buying $SPY at the 50 day sma is a very high probability long set up if we get there.
-
$QQQ at the 21 day is a high probability set up if it dips again.
-
With all the headline risk with Ukraine and Israel and volatility expansion we may get some of these levels, we’ll see.


