-
There is a high probability that volatility continues to rise next week off recent lows with the perceived and expected headline risk in Iraq and the uncertainty about its future.
-
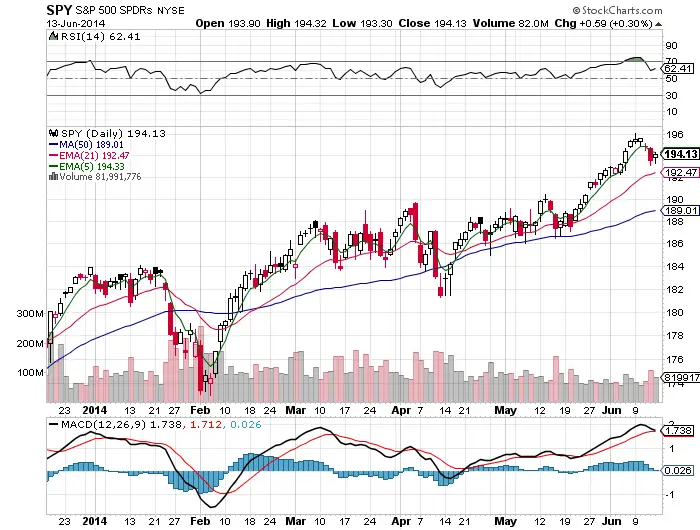
It would create some better set ups for equity traders if the market uses Iraq as an excuse to take profits and bring the $SPY down to lower levels to buy into the longer term up trend.
-
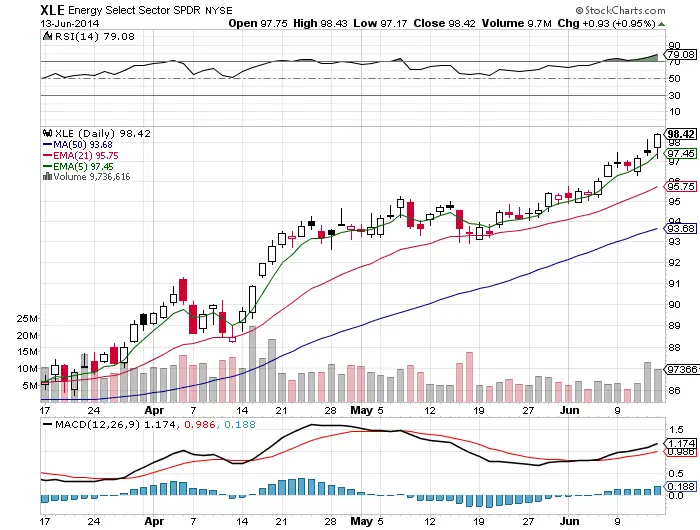
With risk in Iraq the energy sector has really went into an extreme overbought area pushing to near the 80 RSI. The $XLE is the sector I will look at for bearish credit spreads or buying put options on with any sign of weakness. Currently I have been long gold via $UGL off the oversold levels when the RSI was under 30.
-
$AAPL has seemed to have found a short term top after it split and the addition of several billion shares to its share float. $AAPL will likely weigh on the $QQQ and the big cap sector next week as profit taking has set in.
-
Many big leading growth stocks have started to struggle again over the past few days $PCLN $GOOGL $FB this is not what bulls want to see.
-
$SPY How To Trade Without Watching The News
-
The 50 RSI has acted as support since mid April.
-
The next major level of $SPY chart support is the gap up low of day of $190.95 level.
-
The 50 day sma has been the $SPY bounce zone since the middle of April.
-
If the $SPY chart sells down to the 30 RSI on the daily chart that is a great risk/reward area to go long and has been a good long side entry signal over the past 4 years.

