Disclaimer: The below examples are for illustrative purpose only, this is not trading advice, follow your own trading plan and trade your own system. Trade at your own risk.
For those that really want to go long here on $QQQ and attempt to buy the dip in what is still an uptrend on the long term time frame the high probability bounce zone is lining up to be between $82-$83. This lines up with the 200 day moving average and the 30 RSI which are both potential areas for dip buyers to be waiting. While this is not trying to call a bottom it is an area where the odds are that we have a nice initial bounce here that could last multiple days. Great risk/reward and convergence of oversold RSI and the 200 day last line in the sand for bulls which usually bounces initially anyway. It would be better odds to trade the bounce with a smaller than usual position size and wait for it to bounce first back over the 30 RSI or the 200 day before buying into a falling knife. Also be aware that equities as an asset class could end up in a deeper correction and go lower from here directly or after a multi-day reversal. This is also referring to the 14day RSI on the daily chart only and this does give an edge with indexes but the RSI is not as useful with most individual stocks. I will be trading with a much smaller size than usual if I take these entries and also taking a stop loss if I am wrong.
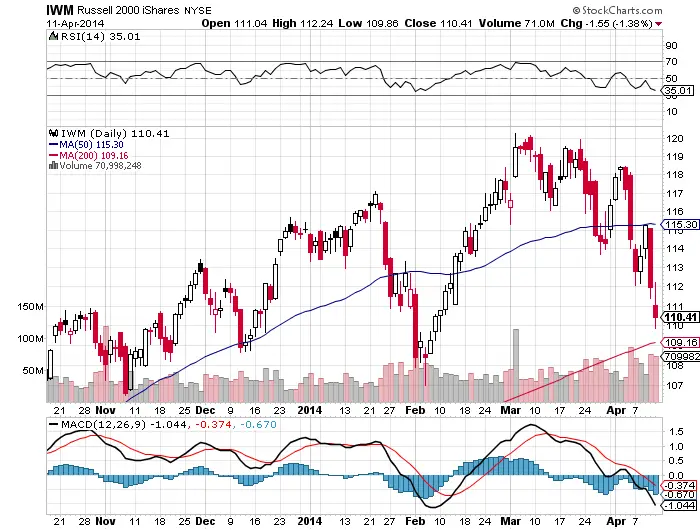
The 30 RSI and 200 day are also close by under the $IWM chart and we could see a volatile bounce here as well.
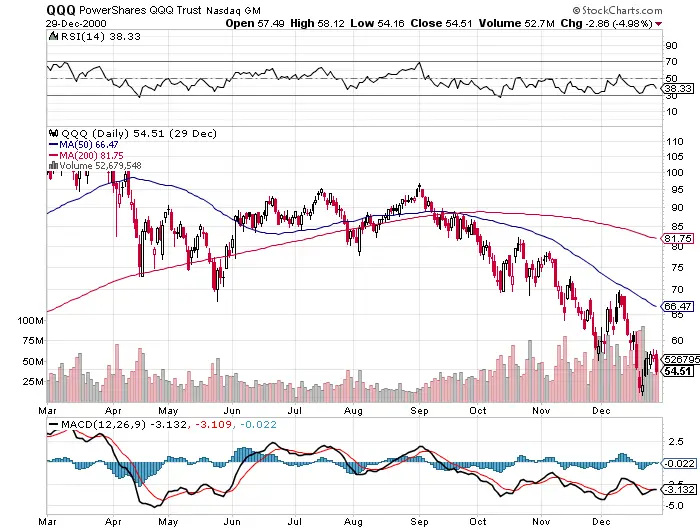
Below is the historical chart of the $QQQ during the post dot-com bubble. Even with what ended up being a 50% decline in the ETF the 30 RSI held up by end of day all but a very few times as bounces ensued before the next sell off to even lower prices. Rallies and short covering can lead to sharp and fast recoveries even in bear markets which makes shorting trends in equities a little more difficult that playing the long side up in bull markets that are more smooth with less corrections.
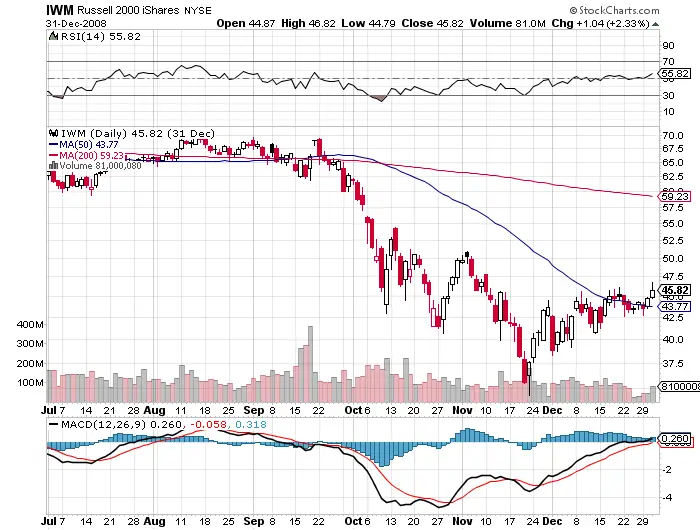
Even in the 2008 market meltdown on the below chart the 30 RSI provided some great buying opportunities for big bounces.


