-
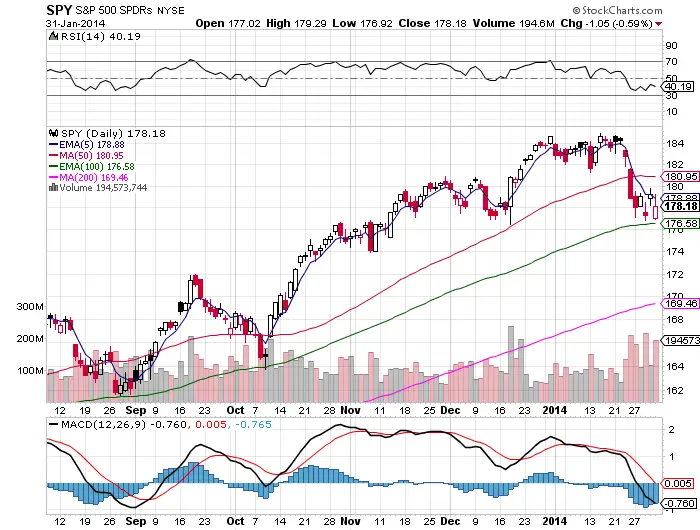
The stock market is still in a long term up trend by staying over the 200 day sma.
-
In the short term down trend the 100 day ema has acted as support.
-
The $SPY price action has been under the 5 day ema for 7 days and has acted as end of day resistance.
-
The 50 day is the line of resistance that $SPY must close over for the first signal of a possible beginning of another possible leg up to all time highs, under the 50 day the odds are we stay in a down trend to the 200 day.
-
If this is really a new intermediate downtrend look for the 50 RSI to likely to be a new level of resistance.
-
It is not a great risk/reward ratio to sell short when RSI is in the 30’s.
-
$SPY has been in a five day trading range $179.50 resistance $177 support.
-
Equities have currently switched from being accumulated to being traded inside a range.
-
For seven days the swing trades have been short the 5 day ema and cover at the 100 day ema. Go long at the 100 day ema and cover at the 5 day ema.
-
This is currently a swing traders and day traders market trying to catch trends and breakouts here has not worked.
