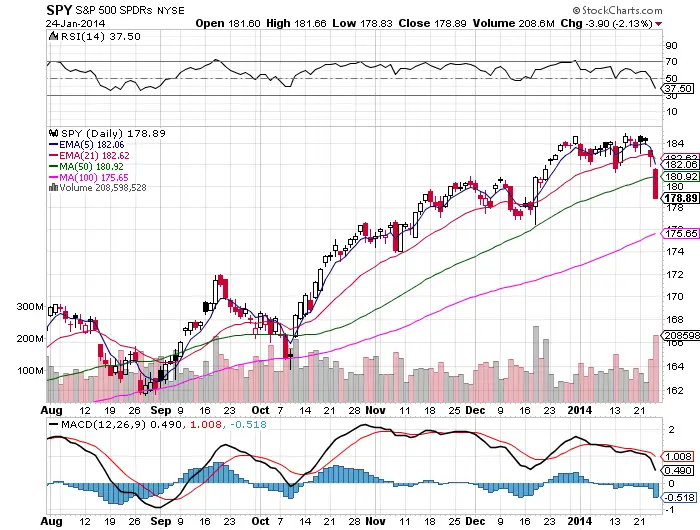
Last week a lot of traders and investors got hurt in their trading accounts. With the market going from trying to break out to new all time highs to crashing through the 50 day in three days there were the quick and there were the dead. The very best traders I know made money due to there flexibility and fast actions. Last week is why it is crucial to always manage your risk and never take a trade that is so big that it will really damage your account when you are wrong.
-
The 50 day line that held since mid October was finally lost, this is very telling of a change in market dynamics. Buying the dip did not work this time.
-
With a move this far this fast the risk/reward advantage has now shifted over to the bear side the vast of that entire potential move down happened in two sessions not leaving much potential profits on the table for any new short positions.
-
Short positions will have better odds of success selling into rallies back up into key resistance areas.
-
The 30 RSI will put in a logical floor area for this move down, it is almost never breached in $SPY even in the strongest downtrends.
-
The 100 day is the next line of support in moving averages it provided bounces in 2013.
-
Be aware that very strong counter rally bounces happen in down trending markets, down trends are much more choppy and difficult to ride than up trends. Down trends go against the long term historical flow of the markets and are not an easy ride for longer periods of time.
-
It is unusual for such a water fall on a Friday with all the weekly option expirations at stake, the hedging of short option postitions was pretty meaningless as people just wanted out of equities.
-
Price is incredibly extended from the 5 day ema and there is a very high probability of a snap back closer to it this week.
-
These big overextended moves don’t necessarily mean we must have a big snap back to all time highs, the chart can simply consolidate at these lower levels and digest the oversold dynamics, which is what the odds are here.
-
$SPY will need to hold the 100 day for the longer term bull market trend to stay in place.
In 2014 I have only had two long stock trades, I took a long with my all my accounts for a break out to all time highs early in the year, I was stopped out of that one for a half percent loss. I then took a dip buy at the 50 day Friday with my smaller trading account and was quickly stopped out of that even before the end of day. I have been using credit spreads in 2014 to play the overbought and oversold levels by selling hedged options even farther out than a trading range with mixed success. So far 2014 is shaping up to be a different animal than 2013 in the equities markets and the key to trading is to keep the profits from the great trending years, wait for valid signals and leave opinions at the door. Anything can happen. Trade with the risk/reward and probabilities on your side and focus on not losing money.
