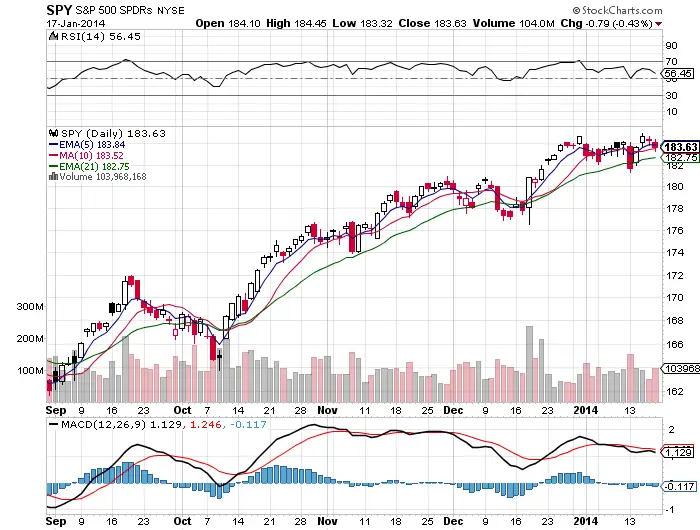
With the action in the markets in the past few weeks I am looking at selling OTM call option premium using bearish credit spreads on $SSO and possibly swing trading long off any deep dips with bounces and shorting reversals off rally peaks in the the 65-70 RSI territory if we get there. We’ll see what happens next.
-
The last two days have made lower highs and lower lows.
-
The second break out to new all time highs in $SPY failed.
-
The MACD is going flat with the short term moving averages converging a sign of a range bound market.
-
The 50 RSI bounce failed to continue higher.
-
There is a high probability that this market is converting to a swing traders market from a trending one. Possible buy points are at bounces off the 21 day ema and the 50 day sma if it get there.
-
Shorting in the hole on breakdowns has not been working in this market only shorting off reversals from highs like taking out the previous days lows.
-
The best probability trade is selling option premium out of the money over resistance at all time highs or under support at the 50 day.
-
Many leading stocks reversing and failing to break out of chart patterns. $AAPL $LNKD $GOOG $FB $PCLN.
-
The historical odds are in favor of a 10% correction this year.
-
The risk reward is skewed in favor of shorts at these levels.
