-
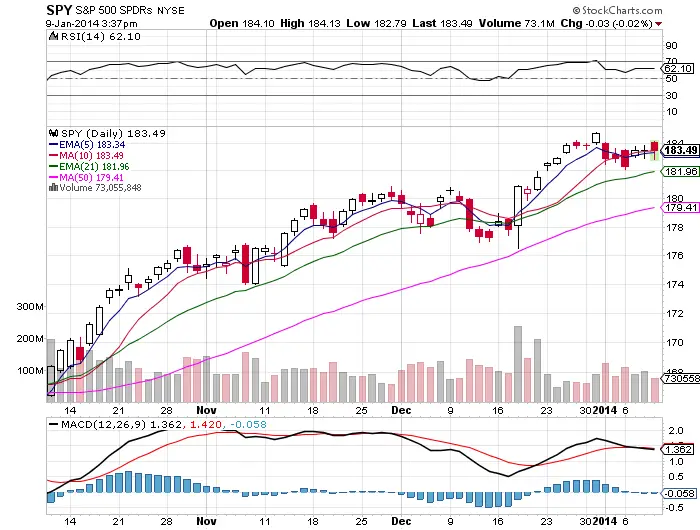
The primary eleven day range is $182 support/$184 resistance. The one day gap up break above $184 was rejected so far.
-
^Short term $SPY is currently range bound.
-
The long term up trend is currently still strong and in place.
-
$SPY opened at the highs of the day and could not find any buyers above the opening level. This is how downtrends start, open high end low.
-
I do not see a good probability long entry at these levels until we either form a longer price base or have a small retracement to give a better potential risk/reward entry.
-
If we break out above the $184 short term resistance we could see a return to all time highs but the 70 RSI will be hanging over head as resistance if we get there.
-
If we do have a rally up to the 70 RSI that level will provide a great risk/return short play.
-
$184 could be a short play with the potential for $SPY to at least return to the $182 support to cover at.
-
A break and close below $182 could signal the loss of short term support and a potential fall to the 50 day sma.
-
I will be patiently waiting for a signal. I am currently holding bearish credit spreads using $SSO calls.
