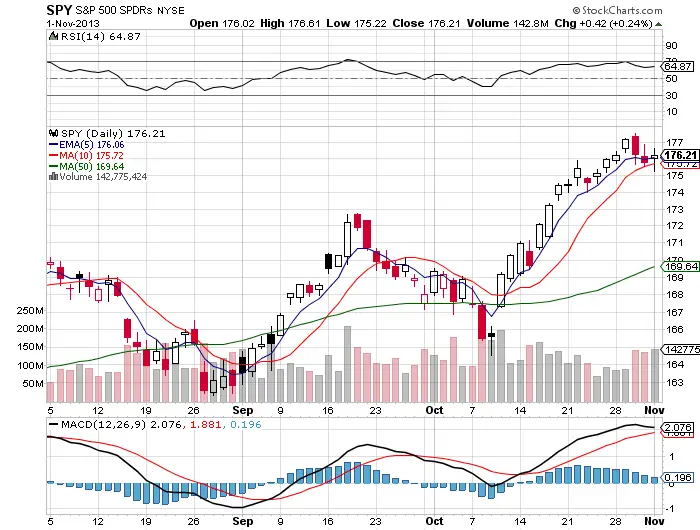
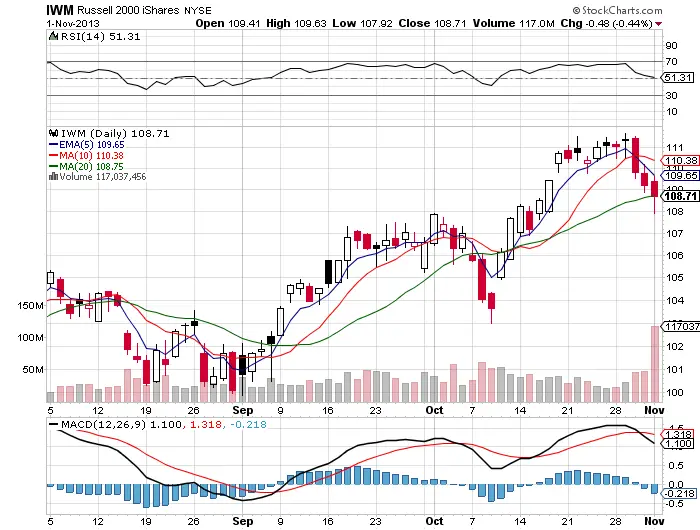
I sold my long positions Thursday as the market started to signal toppiness right on cue at the $SPY 70+ RSI and I am currently just in cash waiting and watching for what happens next. Lots of cracks in the bull horns forming in equities and we may see some consolidation at these levels and maybe even a trading range form. I would not look to short unless the $SPY closes below the 10 day sma and it becomes resistance again. Many individual equities have just been to volatile for me to want to trade with any kind of size using my method while the indexes have provided a smooth ride up and down for most the year. I am waiting and watching to see if this market stays range bound or starts to sell off, I think the odds are currently against a parabolic move back to all time highs next week until price consolidates here and forms a base.
-
The parabolic move failed in overbought territory at $177.51 and profit taking set in as the RSI went over 70. That was the only 2nd time in 15 days that the previous days low was breached.
-
The $SPY now has two days of lower highs and lower lows.
-
The 5 day ema is no longer support, now the 10 day sma is trying to hold as the support line.
-
Currently our next level of support is $175 and then $174.
-
The $IWM could be a leading indicator that equities are starting to be distributed at these levels it quickly fell back to the 20 day sma three days after an all time high. Possible canary in the coal mine here.
-
Many leading stocks growing more volatile and not going higher but settling into trading ranges, this is a clue that we are becoming range bound. $GOOG $FB $PCLN
-
$QQQ the leading index setting nicely in an $83.50 resistance/$82.50 support six day trading range. Which way this index breaks out and closes will be very telling and will likely give clues on what’s next for $SPY as well.


