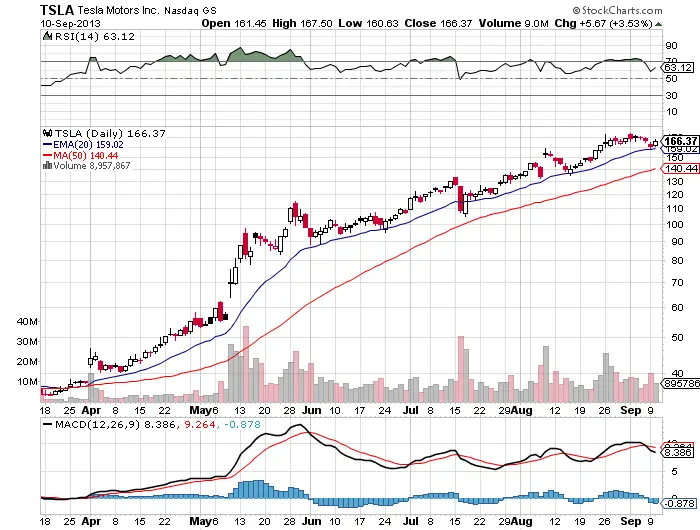
In my short term trend trading I like to ride winning trends that emerge through key long term resistance and support levels by trailing the trend trade with a short term moving average. My two favorites are the 5 day ema and the 10 day sma to use as my trailing stops in a long term winning trade in the strongest leading stocks and markets. However Jesse Stine has pointed out in his book that many stocks have what he calls ‘magic lines’ a key level moving average that holds the vast majority of the time in a monster stock during its entire uptrend. Tesla’s high beta volatility has been hard for many trying to chase it as it reverses on them then stops them out right before it turns around ans soars. Looking back at the huge break out in April Tesla has closed above the 20 day ema every trading day but two. For me the 20 day ema is usually a reversion to the mean level but for Tesla’s high beta and volatile up trend it has acted as a support level for this entire move. The closer a trader can buy at this level the safer the entry. If you miss the bus it usually comes back there to pick up any bulls that want to get on board for this possible trip to the $200 level by the end of the year. The secondary support is the 50 day. A new close below the 20 day ema will be a big warning sign that the strong up trend could be coming to an end, a close below the 50 day will be the time for all the bears to actually have a chance at it from the short side, until then the money is on the long side with the proper buy level.
