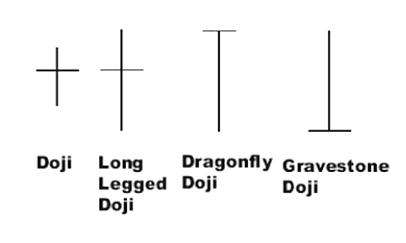
In my trading career I do not remember ever seeing this many doji on any given chart. It is very odd that the open and close be so close to each other day after day after day with all the real movement happening in the post market and pre-market. The biggest clues are the two gravestone doji on Thursday and Monday showing a rejection of the $SPY at the 50 day sma. I am still holding $SPY puts and I am still bearish in this market until we have a close above the 20 day and 50 day. Many leading stocks are still acting very well but there seems to be some trouble brewing in the big picture with the $SPY unable to retake the critical 50 day line.
Definition of ‘Doji’
A name for candlesticks that provide information on their own and also feature in a number of important patterns. Dojis form when a security’s open and close are virtually equal. A doji candlestick looks like a cross, inverted cross or plus sign. Alone, doji are neutral patterns.
Definition of ‘Long-Legged Doji’
A type of candlestick formation where the opening and closing prices are nearly equal despite a lot of price movement throughout the trading day. This candlestick is often used to signal indecision about the future direction of the underlying asset. Long-legged doji candles are deemed to be the most significant when they occur during a strong uptrend or downtrend. The long-legged doji suggests that the forces of supply and demand are nearing equilibrium and that a shift in the direction of the trend may be coming.
Definition of ‘Dragonfly Doji’
A type of candlestick pattern that signals indecision among traders. The pattern is formed when the stock’s opening and closing prices are equal and occur at the high of the day. The long lower shadow suggests that the forces of supply and demand are nearing a balance and that the direction of the trend may be nearing a major turning point. A dragonfly doji pattern is a relatively difficult chart pattern to find, but when it is found within a defined trend it is often deemed to be a reliable signal that the trend is about to change direction.
Definition of ‘Gravestone Doji’
A type of candlestick pattern that is formed when the opening and closing price of the underlying asset are equal and occur at the low of the day. The long upper shadow suggests that the day’s buying pressure was countered by the sellers and that the forces of supply and demand are nearing a balance. This pattern is commonly used to suggest that the direction of the trend maybe nearing a major turning point. A gravestone doji pattern is a common reversal pattern used by traders to suggest that a bullish rally or trend is about to reverse. It can also be found at the end of a downtrend, but this version is much more rare. The close near the day’s low suggests that supply is starting to outweigh demand again.
Source: Investopedia.com

