-
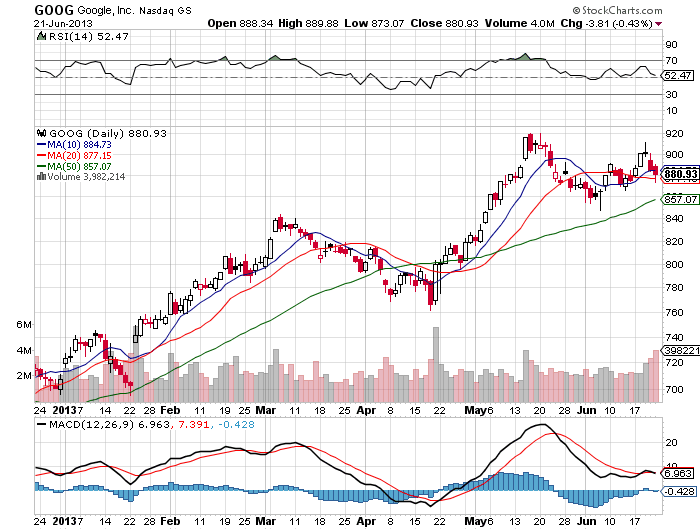
We are looking at a failure to break out to a new all time high Wednesday. With the day of the failed break out closing near the low of the day.
-
Usually only bearish reversals follow a gravestone reversal candlestick, the last two days has been that reversal.
-
We did regain the 20 day after losing it Friday but the 10 day is still acting as resistance. I like to short things under the 10 day.
-
The last two days of selling has happened on growing volume.
-
The 50 day is a logical support level to visit first even if we do reverse and go higher from here.
-
We have had three days of lower highs and lower lows which equals a short term down trend.
-
If the general market has started a correction this will be a leading stock with lots of room to fall to the downside. As rising tides knock over all ships.
-
The more up grades and $1,000 analyst upgrades Google gets the more bearish I become, that is a contrarian indicator.
-
Google is a stock that travels in 100 point trends often, we may be at the start of that trend if this is the beginning of some distribution.
-
The risk/reward has skewed to the downside with the run that it has had this year. I will be looking to buy puts near a bounce to the 10 day sma and play the short side this week.
