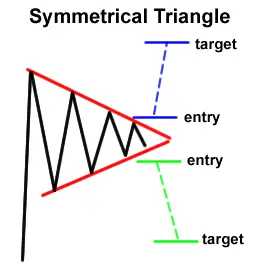
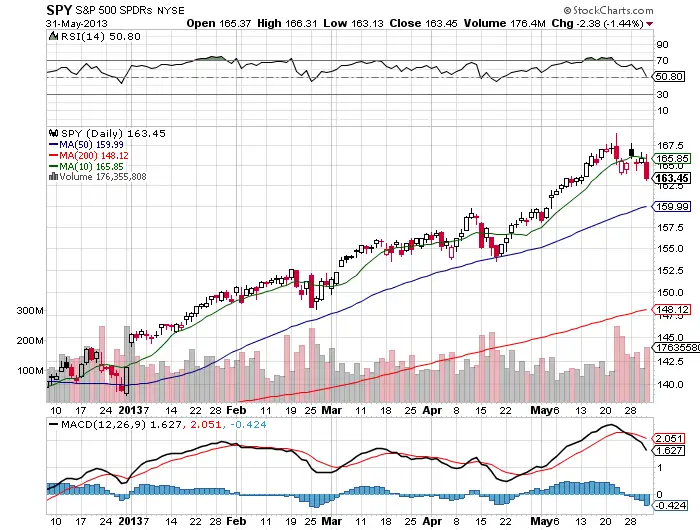
As my blog readers and twitter followers know, I have been concerned that this market was getting toppy after I went to cash at the close on the day we made our all time high at $169.07. Then we failed to get over the 10 day sma for five out of six trading days and even had an island reversal in the middle of the slow choppy roll over. Today near the close I finally went short the SPY at $164.60 with $165 weekly puts as it fell through the bottom of the symmetrical triangle pattern on the chart in my daily time frame. I am now even more bearish in the short term, and here is why:
-
Falling hard on GOOD data today is perhaps the most solid indication we are headed lower.
-
The price extension so far above the 50 day and 200 day have plenty of room for corrections.
-
Volatility expansion is bearish and a sign of a trend change.
-
In five of the past six days the 10 day sma has acted as resistance, this is a bearish signal for my short term trend trading system.
-
SPY broke through the bottom of its triangle chart pattern.
-
SPY price is below the 5 day ema, 10 day sma, and 21 day sma.
-
The four primary bearish candlesticks in this current chart pattern are each lower highs as the go down.
-
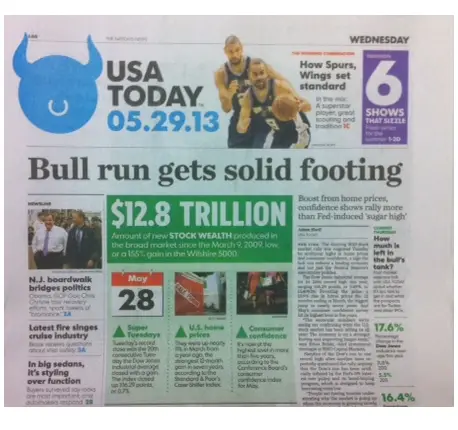
When bulls start appearing on the covers of magazines and newspapers that is generally a sign that the top is near because it has become too obvious.
-
A small correction to the 50 day is normal in a bull market.
-
The topping candlestick at $169.07 and the island reversal on Tuesday were big bear signs.


