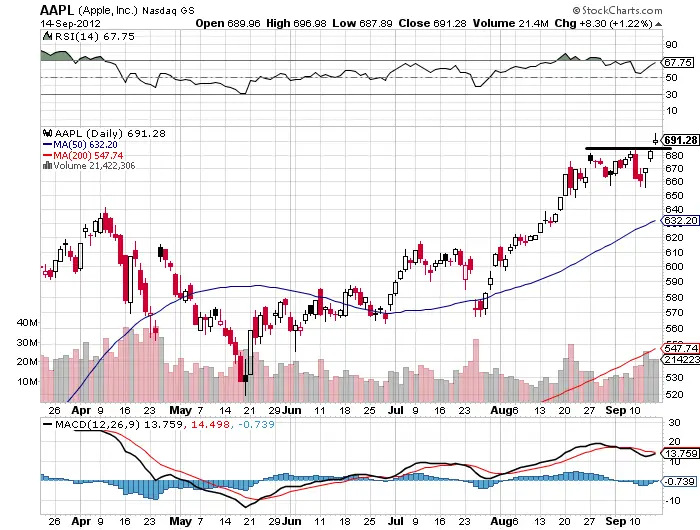
Apple is a strange animal. We have one of the world’s biggest market cap stocks at a value stock price with growth stock earnings. Apple itself is asymmetric, with all the naysayers continuing to believe that it is too big to grow and that it must stumble eventually we are sitting with a 16 P/E in a stock with +78% annual earnings growth. Negativity is already priced in. I do not believe Apple can collapse in price because it is already valued very conservatively. Apple is now a story of a stock growing along with it’s companies REAL earnings growth and cash on hand growing. This can not be a bubble, this is a fair priced stock in a company continuing to change the world. The iPhone 5 hype and real sales numbers should propel this stock to $700 next week, and then buyers and sellers should wrestle with that level. We should have support around the $680 level if this recent break out is real and this is truly a new trading range.

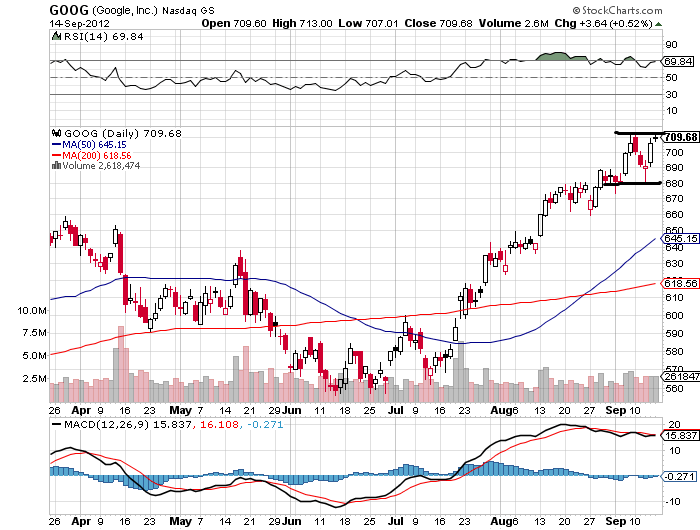
Google is currently trapped in a $680/$713 trading range, if we can break above $713 we could really run 10 points rather quickly. Closing above $713 would be very bullish. I look for support around the $7oo level if we fail for a few days to overtake $713 but I believe that we are transitioning into a real up trend from here with QE3 stirring up the appetite for risk on assets with such terrible interest rates on CDs and deposits. If the Bernanke put really went in the money with QE3 I look for Google to be a leader again in a new phase of the bull market. It has positioned itself well to keep growing and innovating with You Tube, Search, Google+.. Google Glass, and Google cable.

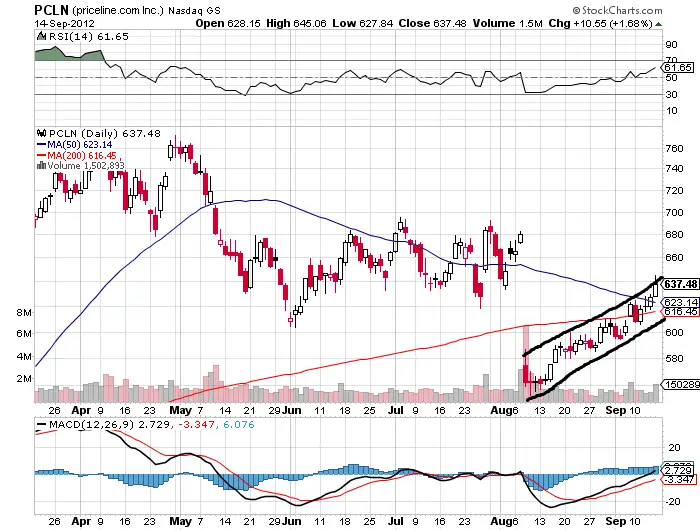
Priceline is in an up trend out of the abyss of its earnings. It is highly linked to Europe due to being a travel site. I believe the Draghi put has also stabilized the fears around European debt and benefited Priceline. The fundamentals on Priceline are still rock solid it is perception primarily that caused this stock to fall so hard. With it’s break above the 50 day and 200 day inside an up trending channel it looks like all systems go. Look for the 50 day to provide support on any pull backs or corrections. If the 50 day is lost and not regained by the close all bets are off, that will be a red flag to get out. If capital continues to flow into this stock it could run to $680 before encountering any major resistance.
