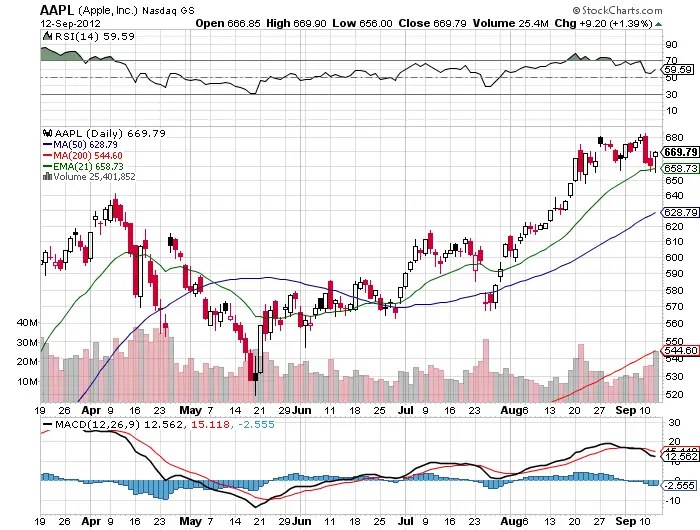
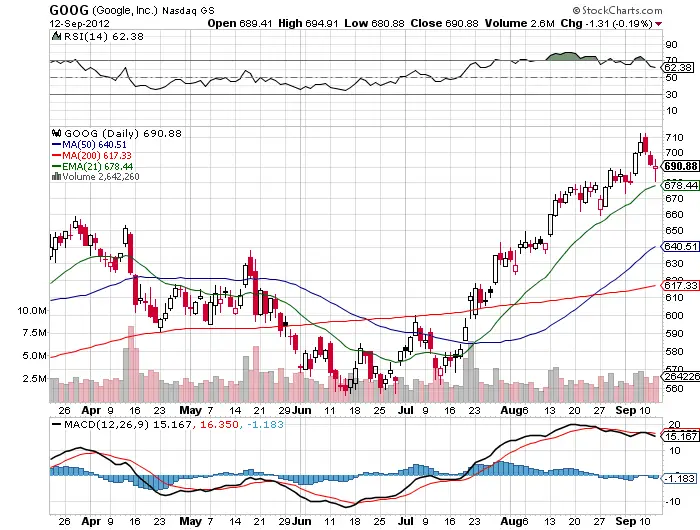
In trading there are moving averages that are watched by many traders. While the most popular are the 50 day and 200 day simple moving averages there is another very popular one that is watched and on many people’s radar. Many traders use the 20 day sma, 21 day sma, or the 21 day exponential moving average. Personally I have used the 20 day sma for market corrections to see if there is a bounce but today the 21 day ema seemed to be the support where buyers were waiting to get back on the up trend. Apple bounced there for two consecutive days and Google bounced there today sharply and quickly. On these charts you can see how over a long period of time where the 21 day ema acted as support and resistance many times when prices approached that level. For me the 21 day comes into play in a range bound sideways market and this is the reversion to the mean level for price. When price starts fighting with this level we are no longer trending we are range bound so it is a signal to buy the dips and sell the rips. Breakouts tend to be break downs at these levels, in healthy up trends the 10 day sma tends to be support. It is not the moving average itself that means anything it is the actions of the traders at that level that creates the meaning of support and resistance. Trade wisely my friends.

