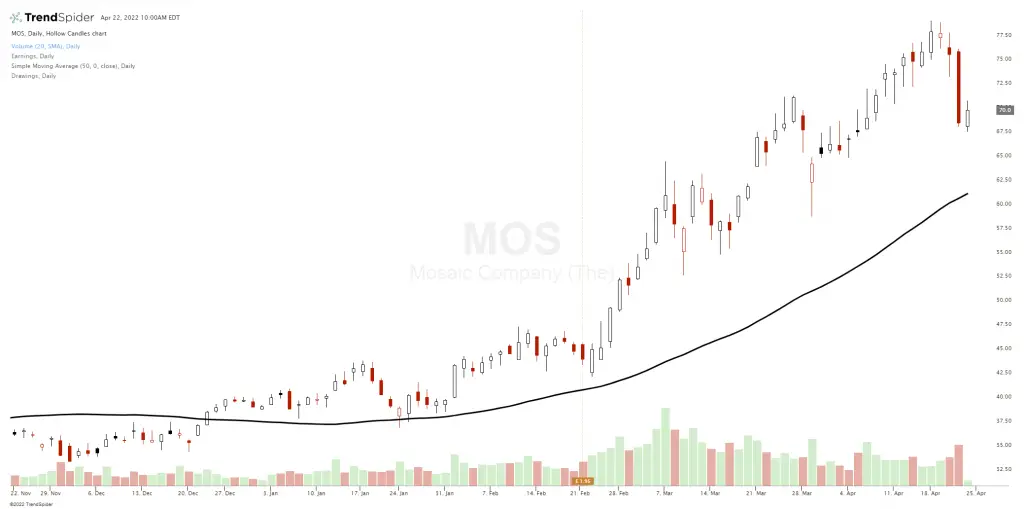
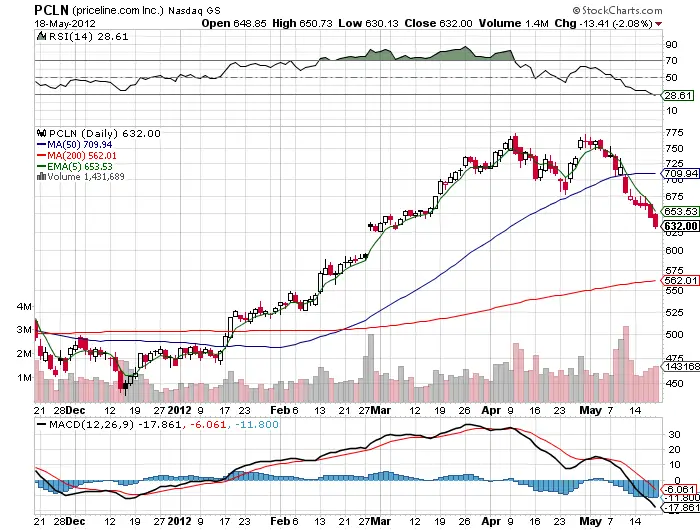
For me the best indicator of a trend is simply price action as measured through using moving averages. Moving averages capture trends visually for the trader, going higher or lower based on the price itself. No only does the power of moving averages lie in their power to measure price trends but they are followed by the vast majority of technicians and traders and are used to make real trading decisions.
For me different moving averages mean different things, here are my personal definitions:
The 5 day exponential moving average is an excellent signal to use for trading sharply trending markets and stocks. It is a great place to measure support in bull markets and resistance in bear markets.
The 10 day simple moving average give a little more room to not be shaken out of a trade and is excellent for keeping you in a trade if you use it as a trailing stop during trends.
The 20 day sma for me is the reversion of the mean for a stock and can be used in range bound markets along with Bollinger Bands if that is your style.
The 50 day sma is the key level of support for the market indexes and hot stocks during bull markets, it is the place to buy if we get a bounce and the place to sell short if it is lost and not recovered by the end of the day.
The 200 day sma is the ultimate line in the sand between bull markets and bear markets. It is generally the place that the best stocks find support in any market. It is the buy point out of bear markets when it can be held for multiple days.
Looking at the charts for this year how do you think you would have done simply using them as your signals to go long and short?


