-
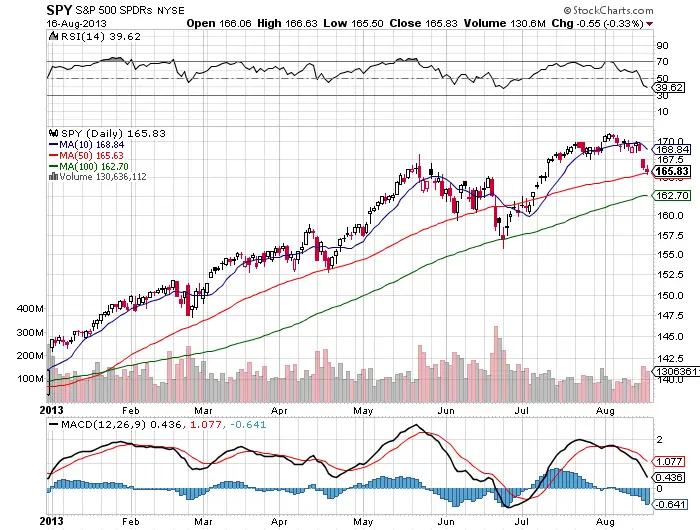
Since breaking over the 50 day back in January the 50 day has held as support 4 out of 5 times. This is the sixth test and it could go either way.
-
Three weeks ago all time highs were rejected so we do have over head resistance to work off as people get back to even.
-
The $168 support level that had held for over 4 weeks was lost Thursday. It was a gap and go beneath the near term support level.
-
The four trading days before the break down the 10 day sma started acting as resistance.
-
The 10 day sma is so far away from the price that we could see a snap back here to as far as the $168 level.
-
Thursday can count as a one month break out of a trading range to the downside.
-
There should be bulls at the 50 day sma waiting to buy as an entry into the longer term up trend. We should see bulls and bears battle it out at the 50 day this week, if not it is a short play with a close below the 50 day.
-
The next support level after the 50 day is the 100 day at $162.70. That is where the previous bounce happened after the loss of the 50 day.
-
Leading stocks have rejected all time highs $TSLA $PCLN $FB $GOOG most are in near term down trends with lower lows and lower highs.
-
I will take a stance with longs if we close above the 50 day and look at short plays if we close below the 50 day. This is the place to keep a open mind and see if the market wants all time highs back or the 100 day is the next level that we see. Either side can run with the ball here and we need to follow the ball carrier.
