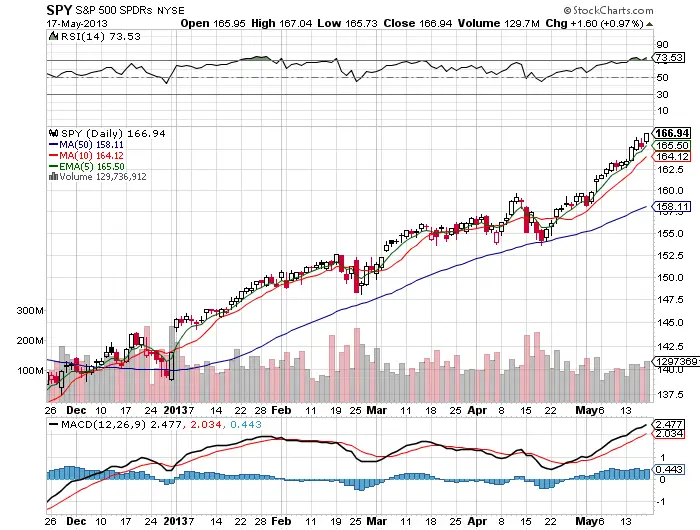
The $SPY has spent 19 days out of 20 closing above the 5 day ema and 19 days straight above the 10 day sma. The 50 day has held in this index for this entire year, if any bears are wondering, this is what an uptrend looks like.
I went fully long in my long term trend following account at around $157ish as it broke above the 10 day sma. My first long was from the beginning of January the day before the fiscal cliff to Early February where volatility shook me out. (All these trades are time stamped on my twitter account).
A close below the 5 day ema will now be my stop. It is hard to fight the momentum with no pressure on $SPY holders to sell and shorts getting hurt daily in this parabolic move. We could go to $170 this week before we see a pull back to a support level. My concern is that I will be violently kicked out of this position when there is a rush to take profits but I will let the market decide that day and continue to ride this wave as far as it will take me by tightening stops. We must all realize we have no resistance at all time highs this is just pure price discovery at these levels with winning traders strategy to “buy the dip” and let the FED work its magic printing presses of cheap money to keep fuel on the fire and alleviate any fear the bulls may have had.
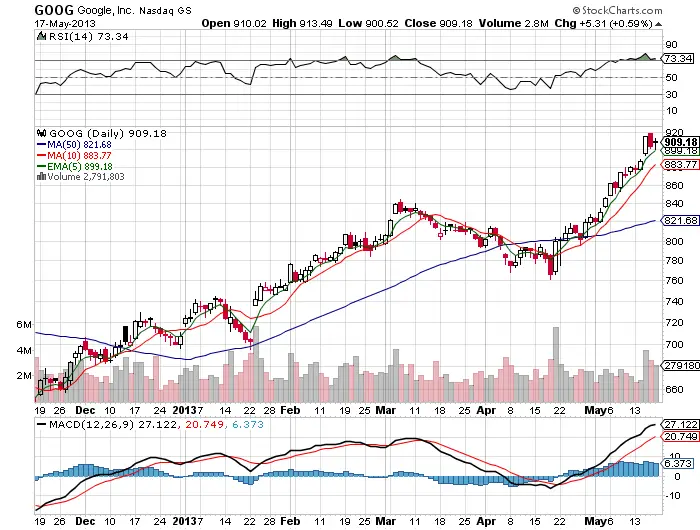
Google launched off the 50 day into a parabolic move. I was able to capture with calls for the most part. it did have a set back Thursday launching to new all time highs at open but then taking back my profits within minutes then rolling over but holding above the previous days lows. Friday was a little more of a slight pull back losing the previous days lows and finding support at the 5 day ema and finally recovering which is what we want to see. The last three days has been in a $900/$920 range instead of the parabolic move we has seen day after day. I think this will be a good range to play on the long side over the next week as it may consolidate. If we close below the 5 day ema it is a time to be cautious, under the 10 day sma I would even consider a short to the 50 day if the market does finally correct.
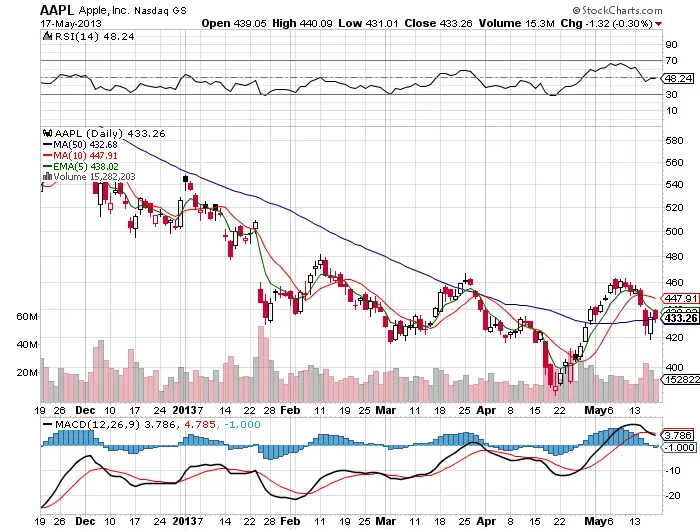
Apple gave the appearance that it had hit the bottom at $420 support and bounced Thursday. I went into Thursday with puts looking for the loss of the $420 level, it did not happen so I sold my puts for a profit and then went long off the bounce with calls. I took those profits and Apple looked strong. But eventually the stock succumbed to the $440 price resistance and the 5 day ema Friday, it was rejected at that level and even lost the 50 day before getting back above it and finding some support there. Apple is still in a long term down trend and the bounce was so far invalidated. This is a simply trade it is safe to be short below the 50 day and long above it with the 50 day as the stop. I will be fishing for a trend in this one after the 50 day shows whether it will become support or resistance.


