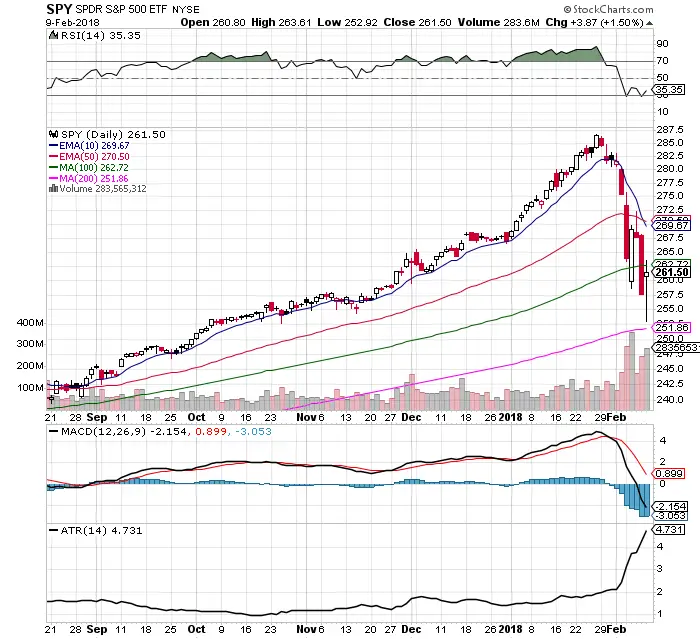
- The bull market is still in place but shaky as volatility expands and long term support levels are tested.
- $SPY bounced off the 200 day SMA Friday. S&P 500 futures bounced near the 200 day SMA overnight last week. The 200 day SMA is the current key support level. A close below this level opens the door for a big downside drop.
- The VIX volatility index, which tracks short-term market turbulence, jumped 116% on Monday — the highest daily percentage recorded. The daily inverse volatility ETF $XIV plunged -95% Tuesday. $VIX spiked to a high of 50.30 last week but closed at 29.06 for one of the most volatile weeks in DJIA point moves of all time.
- $SPY remains under a bearish MACD cross under showing the speed of this reversal from an uptrend.
- The ATR spiked to 4.73 which is the highest trading range recorded in $SPY since October of 2008.
- Trading volume doubled last week for four out of five days. There was high volume on the reversal positive days than the down days.
- The market is in oversold territory at RSI 35.35 but did not respect the 30 RSI last week intraday or at the end of they day. Like oversold 70 RSI was not working as resistance in the powerful bull market since November 2016 the 30 RSI has not been holding as end of day support in this fast correction.
- Price crashed below all key moving averages last week except the 200 day SMA.
- “This is the first time in history the S&P 500 went from a new all-time high to 10% correction in 9 days or less.” – @RyanDetrick
- Most sector ETFs are not respecting oversold support at the 30 RSI. This is a crossroads where we can bounce and get back to all time highs or continue to fall into a 20% bear market.
I am looking to take trend reversal signals using 10 day ema /50 day ema moving average crossover or 200 day sma breaks and reversals to confirm the market reached a short term bottom.