-
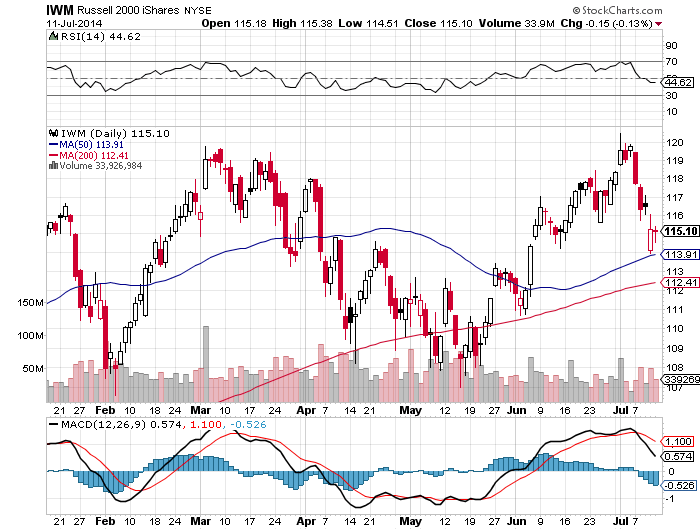
The long term up trend is firmly in place. With the 50 day holding in $IWM & the 21 day ema holding in $SPY. Currently $QQQ is the strongest equity index.
-
All gap downs and dips are still being bought quickly. The Portugal gap down Thursday in $IWM was met with buyers at the 50 day at the open and rallied back through the gap that day. This is very bullish behavior.
-
The markets are shrugging off Iraq, Ukraine, and even possible QE being wound down. The thing is all the scared money and bears sold long ago and now there is a line to get into equities at any opportunity, this is where are the bounces come from.
-
There are much better probabilities buying dips in this market than trying to short strength. A rare pullback to the $SPY 50 day or $IWM 30 RSI would be a golden opportunity to buy for a longer term hold.
-
This current market environment favors buying weakness and selling long positions into strength.
-
The pullbacks have been happening intra-day and fast, big quick bounces are the norm.
-
Very low volatility environments are bullish.
-
The market going up in the midst of fear and bad news is bullish.
-
Traders would be wise to stop trying to pick the top and start profiting from higher highs and pullbacks in this bull market.
-
It’s A Bull Market You Know!
-
Individual Stock Ready List as of 07/11/2014
-
Stocks Digesting Gains And Nothing More

